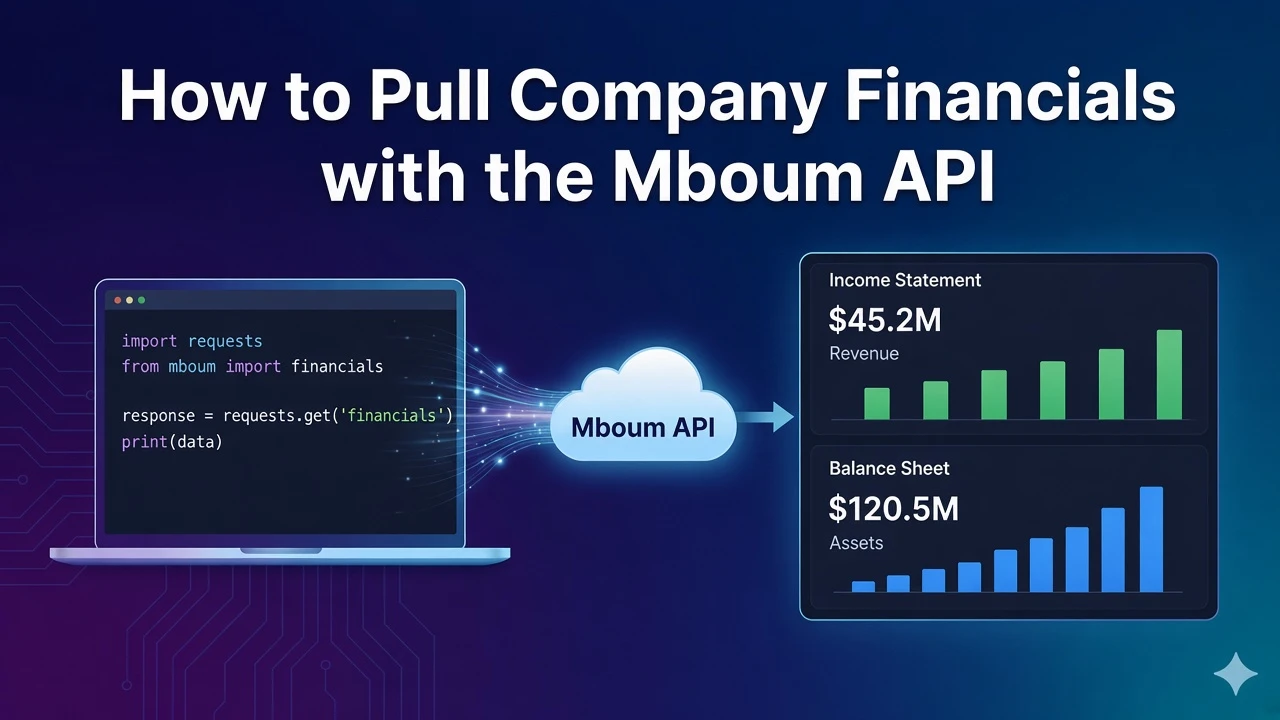
Company financials help you pull income statement, balance sheet, cash flow, and ratio tables for a ticker without scraping filings yourself. After one call with the required ticker, you can read meta.symbol, open each table's headers and rows, and print line labels with the period amounts in value2 through value5.
This tutorial covers GET /v2/markets/stock/financials only. There is no timeframe parameter on this endpoint. This is not the modules endpoint, and the payload has no revenueTable. The example below uses ticker=AAPL.
👉 To access this endpoint, you must obtain an API key: https://mboum.com/pages/api
The Financials Endpoint
Company statements live under GET /v2/markets/stock/financials.
Documentation:
https://docs.mboum.com/#stocks-options-GETapi-v2-markets-stock-financials
Request
GET https://api.mboum.com/v2/markets/stock/financials?ticker=AAPL
Authorization: Bearer YOUR_API_KEY
Parameters
ticker— required. Company symbol (exampleAAPL)
Choosing the Request
For this walkthrough, send ticker=AAPL. That keeps the call on a familiar equity while you learn how headers and row values are shaped.
Do not add a timeframe parameter, and do not call a modules route expecting a revenueTable. Stay on this financials endpoint so the four table names below match what you inspect.
Sample Response
The shortened sample below focuses on incomeStatementTable. The same headers-and-rows pattern applies to balanceSheetTable, cashFlowTable, and financialRatiosTable. headers.value1 is Period Ending:; later headers are period dates. Row value1 is the line label; value2 through value5 are amounts. Sample income labels shown here are Total Revenue, Cost of Revenue, and Gross Profit:
{
  "meta": {
    "symbol": "AAPL"
  },
  "body": {
    "incomeStatementTable": {
      "headers": {
        "value1": "Period Ending:",
        "value2": "09/28/2024",
        "value3": "09/30/2023",
        "value4": "09/24/2022",
        "value5": "09/25/2021"
      },
      "rows": [
        {
          "value1": "Total Revenue",
          "value2": "$383,285,000",
          "value3": "$383,285,000",
          "value4": "$394,328,000",
          "value5": "$365,817,000"
        },
        {
          "value1": "Cost of Revenue",
          "value2": "$210,352,000",
          "value3": "$214,137,000",
          "value4": "$223,546,000",
          "value5": "$212,981,000"
        },
        {
          "value1": "Gross Profit",
          "value2": "$172,933,000",
          "value3": "$169,148,000",
          "value4": "$170,782,000",
          "value5": "$152,836,000"
        }
      ]
    }
  }
}
Python Example
import requests

url = "https://api.mboum.com/v2/markets/stock/financials"
headers = {"Authorization": "Bearer YOUR_API_KEY"}
params = {"ticker": "AAPL"}

response = requests.get(url, headers=headers, params=params)
response.raise_for_status()
payload = response.json()
print(payload.get("meta", {}))
body = payload.get("body") or {}
income = (body.get("incomeStatementTable") or {})
print((income.get("headers") or {}).get("value1"))
for row in income.get("rows") or []:
    if isinstance(row, dict) and row.get("value1") in (
        "Total Revenue",
        "Cost of Revenue",
        "Gross Profit",
    ):
        print(row.get("value1"), row.get("value2"), row.get("value3"))
Understanding the Response
meta.symbolechoes the ticker you requestedbodyincludesincomeStatementTable,balanceSheetTable,cashFlowTable, andfinancialRatiosTable- Each table has
headersandrows;headers.value1isPeriod Ending:, and later headers are period dates - Row
value1is the line label;value2throughvalue5are amounts. Do not expect avalue6
Start with the three sample income labels above when you verify the shape, then open the sibling tables the same way. Amounts arrive as display strings, so parse them before any ratio math.
Walkthrough
- Call financials with the required
tickeronly — no timeframe parameter and no modules path. - Confirm
meta.symbol, then openincomeStatementTableheaders and rows. - Print Total Revenue, Cost of Revenue, and Gross Profit from
value1throughvalue5, then parse the amount strings before math.
Watch for This
Amounts are display strings such as "$383,285,000", so parse them before math. Also remember this endpoint has no revenueTable and is not the modules route.
Stay on the financials endpoint with a single required ticker until you have printed live income rows and confirmed that amount fields are display strings. Once that shape is clear, the same headers-and-rows pattern applies to the balance sheet, cash flow, and ratios tables in the same payload.
👉 Get your API key and pull financials: https://mboum.com/pages/api