Over the past year I’ve experimented with a bunch of financial data APIs while building trading tools, dashboards, data dashboards, and research side projects. I also came across a detailed comparison article that helped me refine my list. What follows is a curated overview of the APIs I’ve found most practical — whether you’re building prototypes, production apps, or research tools.
For each API I kept it simple: what it is, pricing, whether it has a free tier, and where to find it.
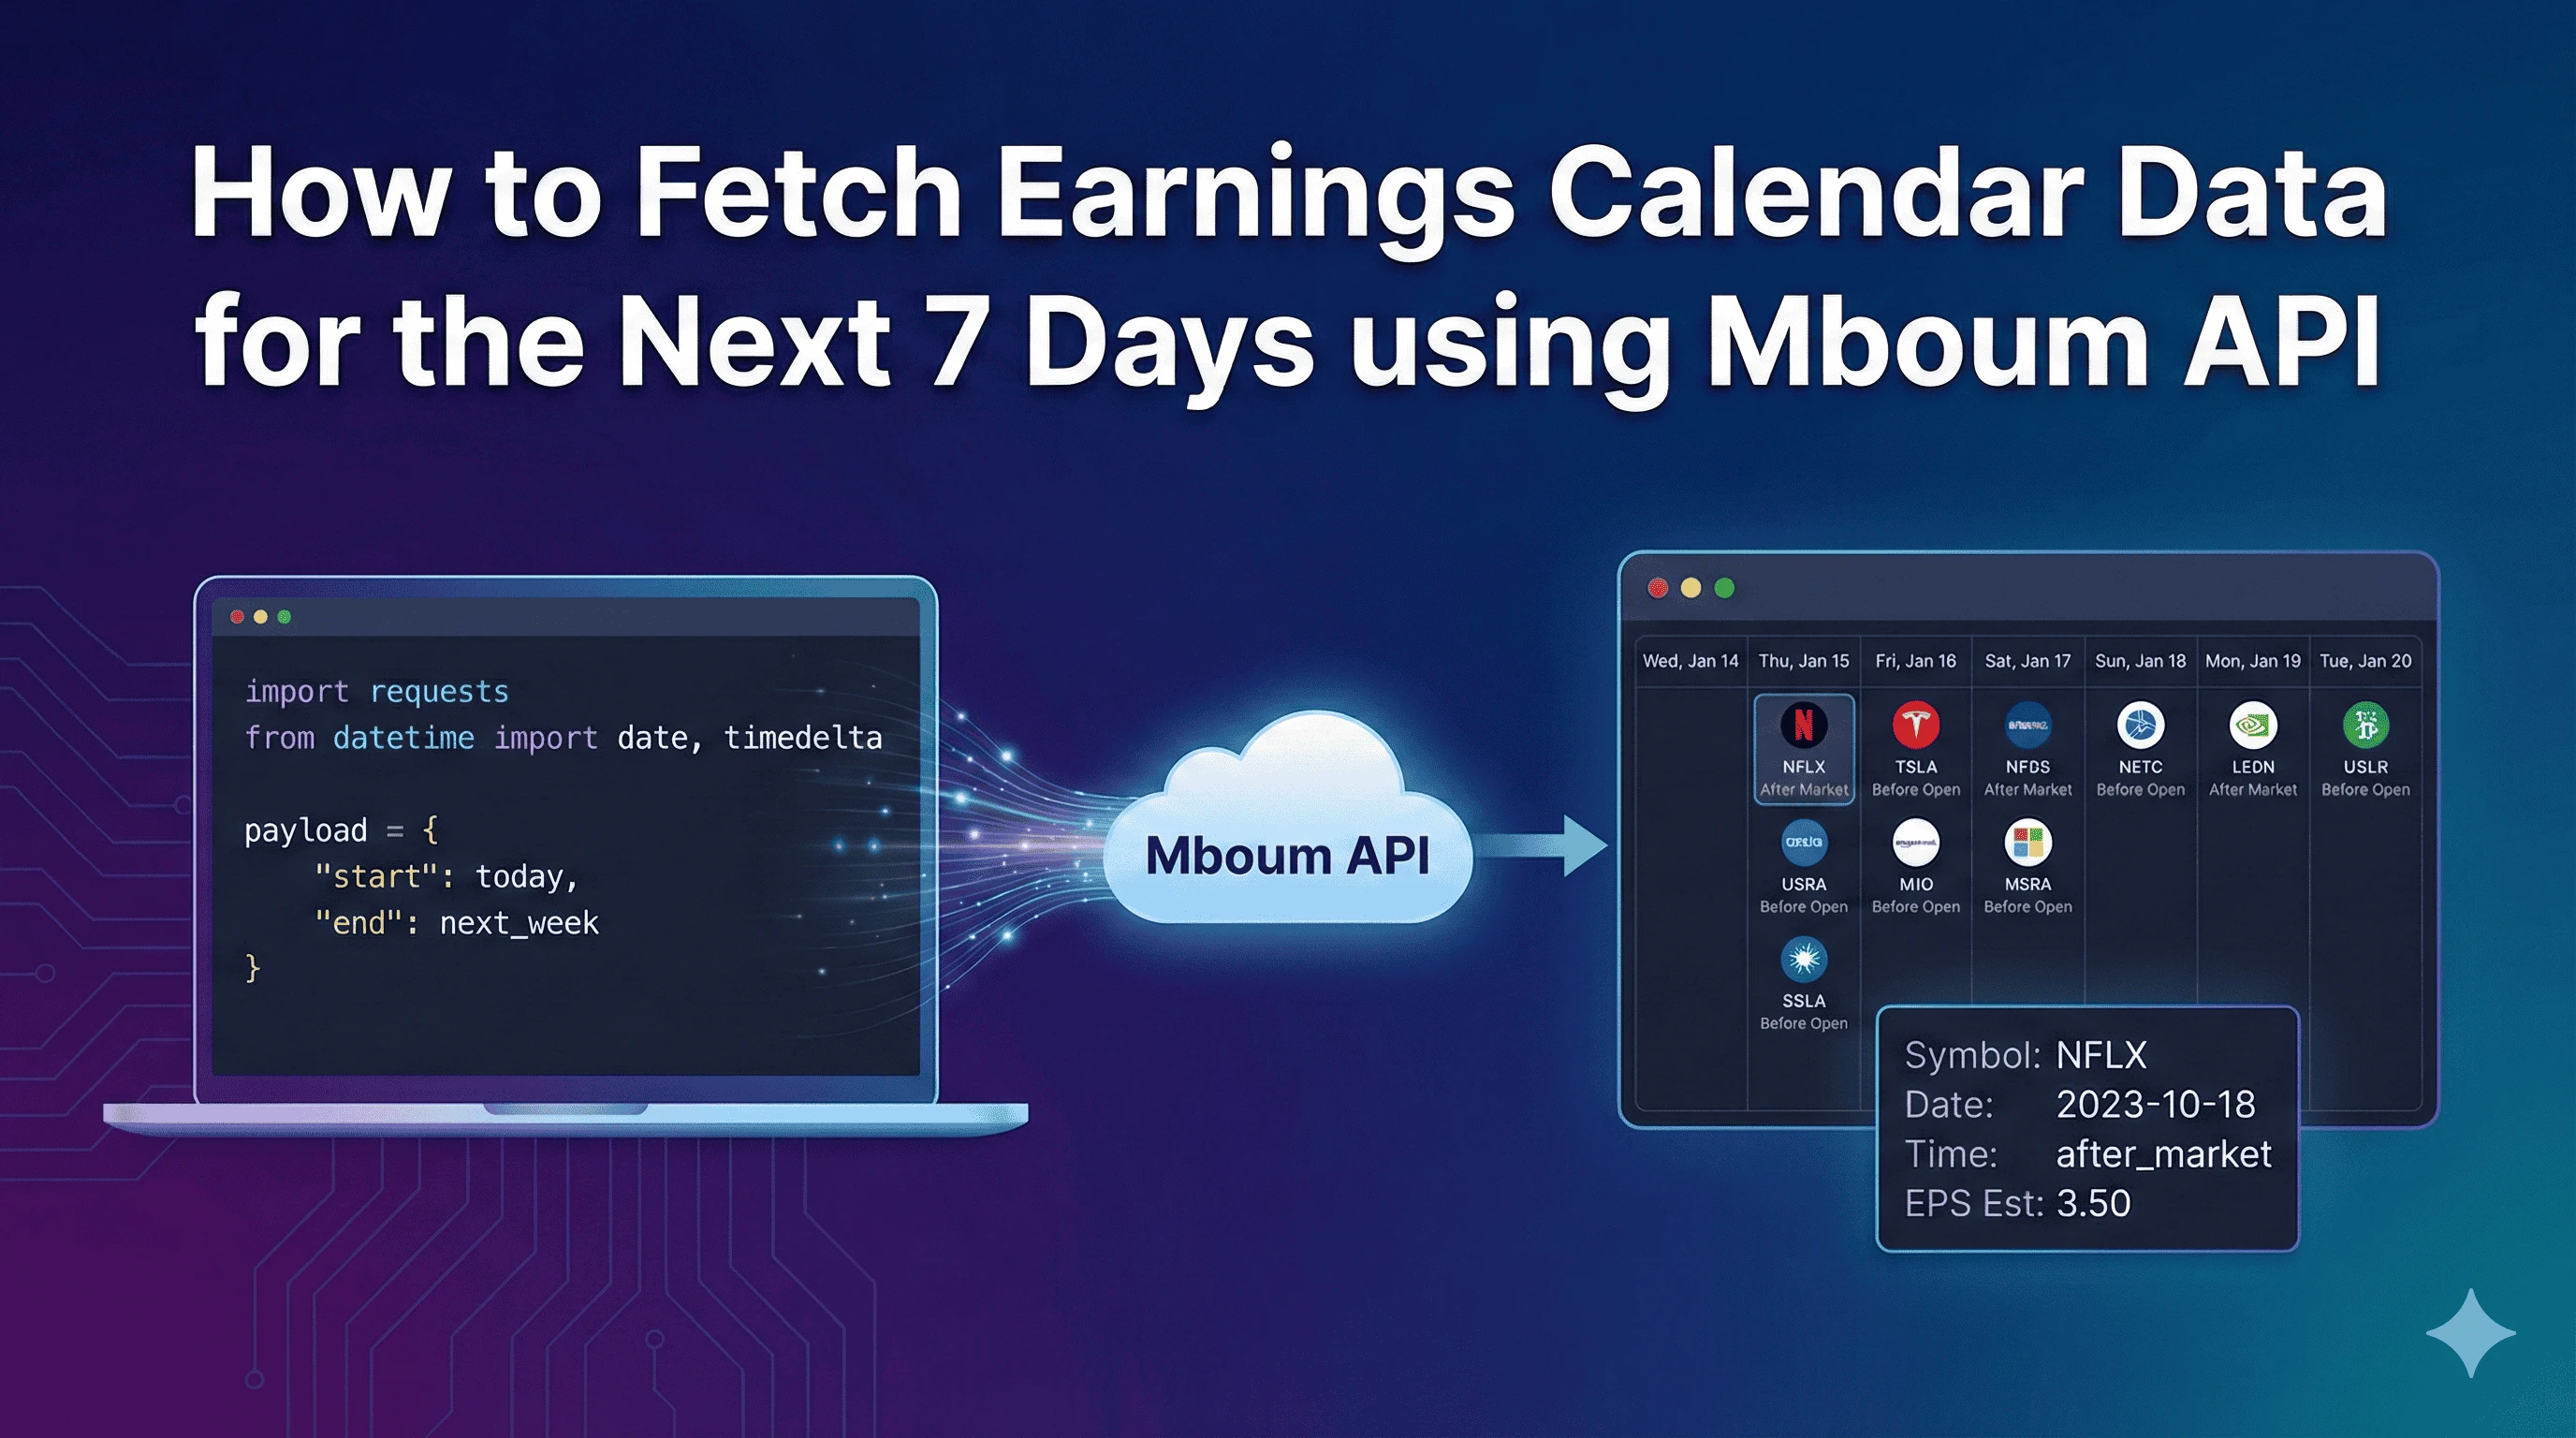
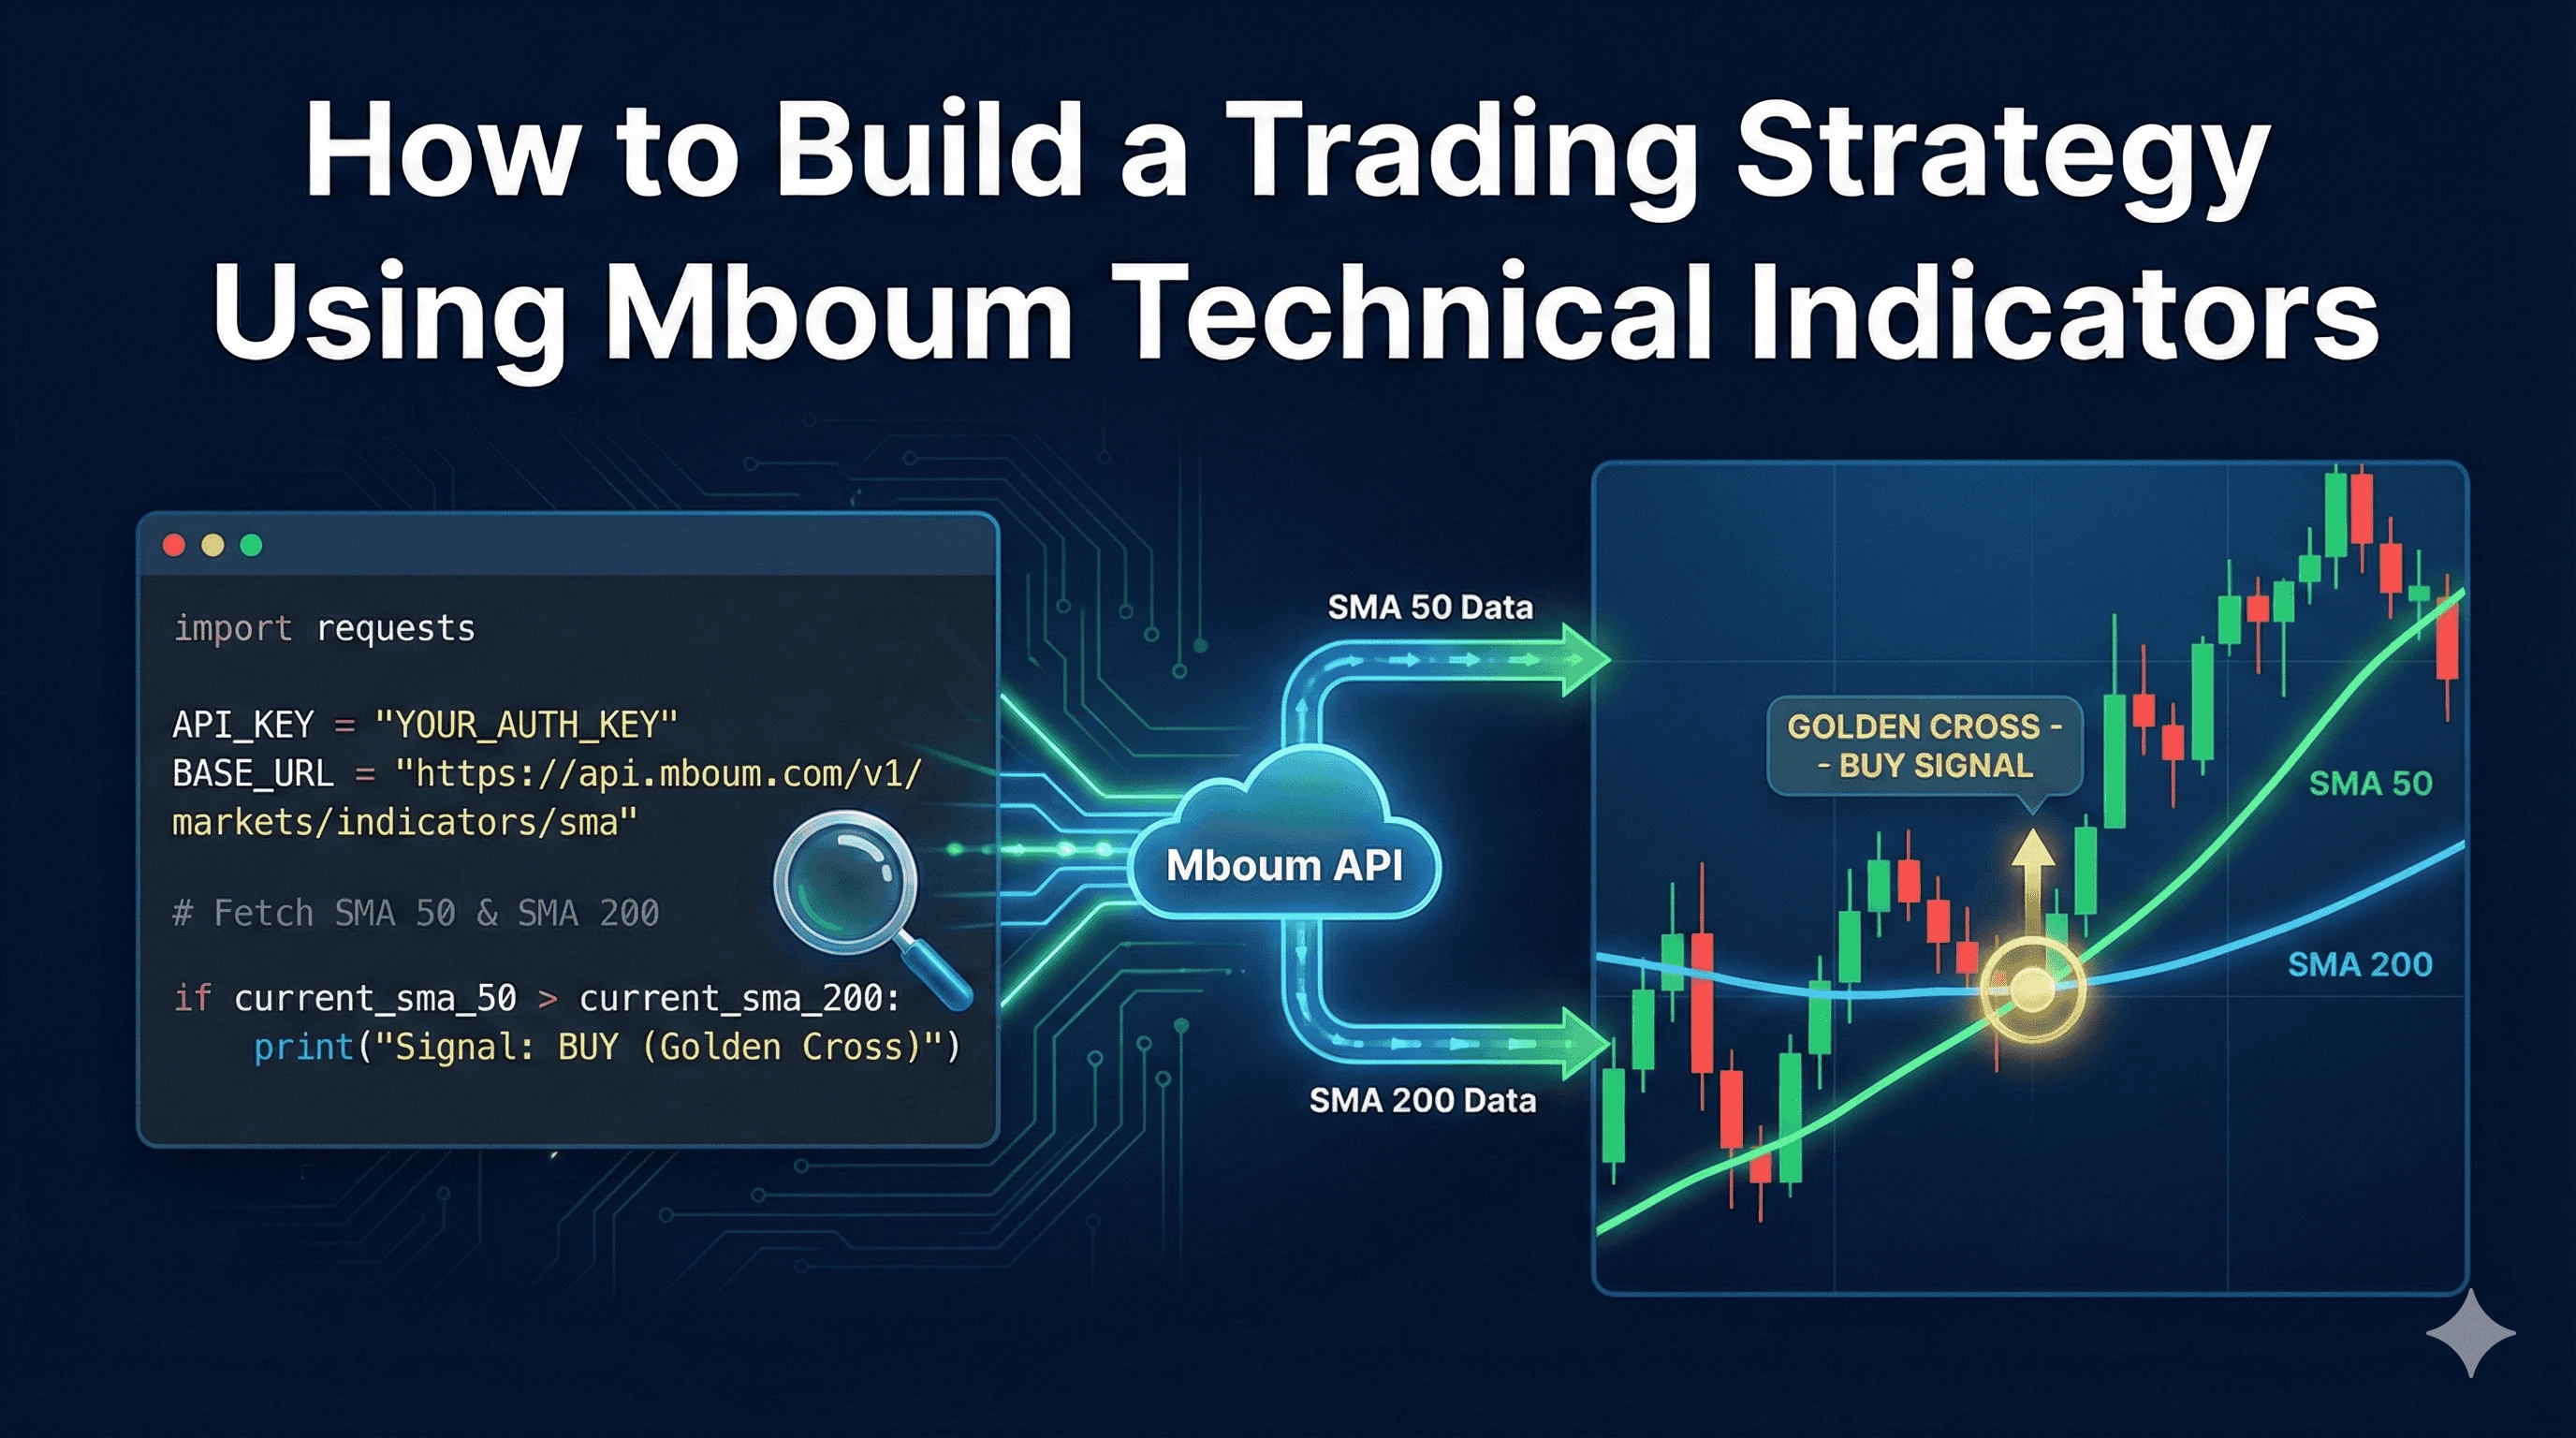
1. Mboum API — Stock & Options Data (Recommended)
What it does: Real-time and historical data for equities and options, market events (earnings, dividends), search endpoints, and technical indicators — with straightforward REST access and examples in Python/JS/PHP. Mboum also supports intraday and end-of-day pricing along with calendar events.
-
Price: Free tier available; paid plans start at ~$9.95/month
-
Free tier: Yes — 100 requests/month
-
Why I like it: A solid balance of data depth and simplicity for both stock and options data. Great for developer projects or smaller dashboards.
2. EODHD API — Historical & Fundamental Data
What it does: Provides historical end-of-day and intraday prices, fundamental financial ratios, dividends, splits, earnings, and macroeconomic calendars.
-
Price: Free tier (20 requests/day), paid from ~ $17.99/month
-
Free tier: Yes
-
Link: https://eodhd.com/
-
Best for: Drill-downs into fundamentals and building dashboards or models.
3. Alpha Vantage — Time Series & Indicators
What it does: Great for daily and intraday time series, built-in technical indicators (RSI, MACD, etc.), and forex/crypto data.
-
Price: Free tier (limited by rate), premium from ~ $29.99/month
-
Free tier: Yes
-
Best for: Algorithmic trading setups and indicator-rich data.
4. Yahoo Finance (via yfinance)
What it does: A Python library for pulling Yahoo Finance data — historical OHLC, volumes, dividends, and some ratios. Note this isn’t an “official” API, but it’s very convenient.
-
Price: Free
-
Free tier: Yes
-
Best for: Quick prototyping in Python or POCs.
5. Polygon.io — Real-Time & Historical Market Data
What it does: Real-time and historical quotes, WebSockets for live feeds, and tick-level data for stocks, crypto, and options.
-
Price: Free tier available; paid plans start around $29/month
-
Free tier: Yes
-
Link: https://polygon.io/
-
Best for: Applications needing live streams or US-focused market depth.
6. Alpaca Markets — Trading + Market Data API
What it does: Commission-free trading and market data, with paper trading support and brokerage integration.
-
Price: Free access to trading API and base data
-
Free tier: Yes
-
Link: https://alpaca.markets/
-
Best for: Trading bots and automated execution systems.
7. Finnhub — News, Fundamentals, Crypto Data
What it does: Mixed data including news with sentiment, earnings calendars, estimates, and crypto coverage.
-
Price: Free tier available; paid plans start ~ $50/month
-
Free tier: Yes
-
Link: https://finnhub.io/
-
Best for: Projects that combine fundamentals and sentiment/news signals.
8. SteadyAPI — Easy Visualization & Dashboards
What it does: Real-time and historical data for equities and options, market events (earnings, dividends), search endpoints, and technical indicators — with straightforward REST access and examples in Python/JS/PHP.
-
Price: Free tier available; paid from ~ $14.95/month
-
Free tier: Yes
-
Link: https://steadyapi.com
-
Best for: Fast prototyping and Excel/Sheets integration. Also includes other API such as Amazon, Reddit, and Instagram for a low price.
How I Think About Choosing One
-
Learning / prototyping: Yahoo Finance via yfinance, Alpha Vantage
-
Full trade stacks: Alpaca + Polygon
-
Fundamentals + modeling: EODHD, Finnhub
-
Balanced and recommended: Mboum hits a sweet spot of simple pricing, good coverage, and ease of use — perfect for a lot of stock/option-related applications.