How to Screen Overbought RSI Stocks with the Mboum API
The overbought RSI screen helps you find high-volume names with a 20-day RSI above 70, without rebuilding RSI logic yourself.
READ MOREAPI Features
Mboum API provides real-time and historical stock market data, company financial statements, insider and institutional trading data, earnings releases, and more. We provide comprehensive coverage of US and international markets, including equities, indices, funds, derivatives, OTC securities, and crypto.
Access real-time and historical data on stocks, including price movements, trends, and detailed financials. See examples
Dive deep into options pricing, implied volatility, and Greeks to improve your strategy and risk management. See examples
Never miss key market events! Stay up-to-date with earnings, dividends, insider trades, IPOs, and more to keep your strategies sharp. See examples
Explore in-depth historical data and visual charts for stocks, options, and cryptocurrencies. Analyze past price movements, trends, and market performance. See examples
Access real-time technical indicators like RSI, MACD, Bollinger Bands, and more to help you analyze market trends and make informed decisions. See examples
Get up-to-date information on over 2,000 cryptocurrencies, including live price data, market capitalization, trading volumes, and historical performance. See examples
Response data samples of the different kinds of objects the API provides
{
  "shortname": "Apple Inc.",
  "quoteType": "EQUITY",
  "symbol": "AAPL",
  "index": "quotes",
  "score": 18407500,
  "typeDisp": "Equity",
  "longname": "Apple Inc.",
  "exchDisp": "NASDAQ",
  "sector": "Technology",
  "sectorDisp": "Technology",
  "industry": "Consumer Electronics",
  "industryDisp": "Consumer Electronics",
  "dispSecIndFlag": true
}
{
  "date": "2025-07-17",
  "date_utc": 1752759000,
  "open": 210.63,
  "high": 210.91,
  "low": 210.45,
  "close": 210.8,
  "volume": 3112753
}
[
  {
    "value1": "EPS",
    "value2": "$1.65 (03/29/2025)",
    "value3": "$1.53 (03/30/2024)",
    "value4": "$1.53 (04/01/2023)"
  },
  {
    "value1": "Dividends",
    "value2": "$0.26",
    "value3": "$0.25",
    "value4": "$0.24"
  }
]
{
  "eps": "$1.62",
  "surprise": "31.71",
  "time": "time-not-supplied",
  "symbol": "DELL",
  "name": "Dell Technologies Inc.",
  "marketCap": "$83,885,429,502",
  "fiscalQuarterEnding": "Oct/2023",
  "epsForecast": "$1.23",
  "noOfEsts": "5"
}
{
  "language": "en-US",
  "region": "US",
  "quoteType": "EQUITY",
  "typeDisp": "Equity",
  "quoteSourceName": "Nasdaq Real Time Price",
  "triggerable": true,
  "customPriceAlertConfidence": "HIGH",
  "exchangeTimezoneShortName": "EDT",
  "gmtOffSetMilliseconds": -14400000,
  "market": "us_market",
  "esgPopulated": false,
  "regularMarketChangePercent": -0.0666156,
  "regularMarketPrice": 210.02,
  "currency": "USD",
  "marketState": "POSTPOST",
  "hasPrePostMarketData": true,
  "postMarketChangePercent": 0.1045,
  "postMarketPrice": 210.2395,
  "regularMarketDayRange": "209.59 - 211.8",
  "regularMarketVolume": 47738194,
  "regularMarketPreviousClose": 210.16,
  "bid": 200.02,
  "ask": 221,
  "fullExchangeName": "NasdaqGS",
  "financialCurrency": "USD",
  "averageDailyVolume3Month": 53661290,
  "fiftyTwoWeekRange": "169.21 - 260.1",
  "dividendRate": 1.04,
  "dividendYield": 0.51,
  "epsTrailingTwelveMonths": 6.43,
  "epsForward": 8.31,
  "priceEpsCurrentYear": 29.2266,
  "sharesOutstanding": 14935799808,
  "bookValue": 4.471,
  "marketCap": 3136816676864,
  "averageAnalystRating": "2.1 - Buy",
  "tradeable": false,
  "cryptoTradeable": false,
  "shortName": "Apple Inc.",
  "longName": "Apple Inc.",
  "displayName": "Apple",
  "symbol": "AAPL",
  "preMarketChange": null,
  "preMarketPrice": null
}
{
  "symbol": "AAPL",
  "exchange": "NASDAQ",
  "symbolName": "Apple Inc",
  "symbolType": 1,
  "baseCode": "A",
  "symbolCode": "STK",
  "previousPrice": "210.16",
  "previousHighPrice": "212.40",
  "previousLowPrice": "208.64",
  "weeklyPreviousPrice": "211.16",
  "weeklyPreviousHighPrice": "216.23",
  "weeklyPreviousLowPrice": "207.22",
  "monthlyPreviousPrice": "205.17",
  "monthlyPreviousHighPrice": "207.39",
  "monthlyPreviousLowPrice": "195.07",
  "chartTime": "2025-07-17T18:55:00",
  "shortSymbol": "AAPL",
  "hasBats": "Yes",
  "hasJerq": "Yes",
  "lastPrice": "210.02",
  "percentChange": "-0.07%",
  "priceChange": "-0.14",
  "openPrice": "210.57",
  "lowPrice": "209.59",
  "highPrice": "211.80",
  "pointValue": "1.00000",
  "highPrice1y": "260.10",
  "lowPrice1y": "169.21",
  "weightedAlpha": "-7.96",
  "meanTargetEstimate": "230.92",
  "highTargetEstimate": "300.00",
  "lowTargetEstimate": "139.00"
}
{
  "symbol": "AAPL|20250718|90.00C",
  "baseSymbol": "AAPL",
  "strikePrice": "90.00",
  "expirationDate": "07/18/25",
  "moneyness": "+57.15%",
  "bidPrice": "119.50",
  "midpoint": "120.88",
  "askPrice": "122.25",
  "lastPrice": "120.25",
  "priceChange": "+0.25",
  "percentChange": "+0.21%",
  "volume": "12",
  "openInterest": "417",
  "openInterestChange": "+12",
  "volatility": "722.09%",
  "delta": "0.9925",
  "rho": "0.0024",
  "vega": "0.0023",
  "theta": "-0.8325",
  "optionType": "Call",
  "daysToExpiration": "1",
  "tradeTime": "07/17/25",
  "averageVolatility": "25.61%",
  "historicVolatility30d": "17.53%",
  "baseNextEarningsDate": "07/31/25",
  "dividendExDate": "N/A",
  "baseTimeCode": "After Close",
  "expirationType": "monthly",
  "impliedVolatilityRank1y": "27.23%",
  "symbolType": "Call"
}
{
  "dealID": "1313721-111920",
  "proposedTickerSymbol": "MGRT",
  "companyName": "Mega Fortune Co Ltd",
  "proposedExchange": "NASDAQ Capital",
  "proposedSharePrice": "4.00",
  "sharesOffered": "3,750,000",
  "pricedDate": "7/16/2025",
  "dollarValueOfSharesOffered": "$15,000,000",
  "dealStatus": "Priced"
}
Dive into our API Documentation with examples in Bash, JavaScript, PHP, and Python. Effortlessly integrate our APIs to bring your ideas to life.
Our statistics
With our platform, access reliable and accurate stock and options data, empowering you to make informed decisions.
500+ MillionAPI Requests Per Month
Over 10,000Developers Worldwide
20+ EndpointsCovering Multiple APIs
24/7Support within Minutes
Testimonial
Discover how our platform is empowering developers, businesses, and investors worldwide. Hear directly from our satisfied users about the value and impact of our services.
Mboum's API is a game-changer for our stock and options analysis. The data is always accurate and up-to-date, and their customer support is top-notch. We couldn't ask for a better service!
 Financial Analyst
As a developer, integrating Mboum's API into our application was incredibly easy. The endpoints are robust and the documentation is clear. Our users are loving the seamless experience.
 Software Engineer
The best API for stock market data! Mboum provides comprehensive and reliable data for both stocks and options. It's an essential tool for our trading platform.
 Product Manager
I highly recommend Mboum to anyone who needs stock and options data. Their service is fast, accurate, and customer support has always been very responsive to our needs.
 Financial Analyst
Our pricing
Find the perfect plan for your needs—from solo developers to large enterprises. Explore our pricing and unlock powerful data-driven APIs. Custom plans available.
Investor $9.95 per month | Business Popular $34.95 per month | Developer $179.95 per month | Enterprise $399.95 per month | Institutional $699.95 per month | |
|---|---|---|---|---|---|
| Subscribe | Subscribe | Subscribe | Subscribe | Subscribe | |
| Requests per month | 10,000 | 50,000 | 250,000 | 2,500,000 | 5,000,000 |
| Stock Endpoints | |||||
| Options Endpoints | |||||
| Calendar Events | |||||
| Technical Indicators | |||||
| Historical Data | |||||
| Stock Financial Data | |||||
| Stock Screeners | |||||
| Insider Traders | |||||
| Real-time Sec Filings | |||||
| Commercial Use | |||||
| Optional overage rate* | $1.50 per 1,000 requests | $1.05 per 1,000 requests | $0.50 per 1,000 requests | $0.09 per 1,000 requests | $0.05 per 1,000 requests |
| Overage cap | up to 50,000 extra | up to 250,000 extra | up to 1,250,000 extra | up to 12,500,000 extra | up to 25,000,000 extra |
Investor $8.00 per month$95.95 billed yearly | Business Popular $29.00 per month$347.95 billed yearly | Developer $144.00 per month$1,727.95 billed yearly | Enterprise $320.00 per month$3,839.95 billed yearly | Institutional $699.95 per month$8,399.40 billed yearly | |
|---|---|---|---|---|---|
| Subscribe | Subscribe | Subscribe | Subscribe | Subscribe | |
| Requests per month | 10,000 | 50,000 | 250,000 | 2,500,000 | 5,000,000 |
| Stock Endpoints | |||||
| Options Endpoints | |||||
| Calendar Events | |||||
| Technical Indicators | |||||
| Historical Data | |||||
| Stock Financial Data | |||||
| Stock Screeners | |||||
| Insider Traders | |||||
| Real-time Sec Filings | |||||
| Commercial Use | |||||
| Optional overage rate* | $1.50 per 1,000 requests | $1.05 per 1,000 requests | $0.50 per 1,000 requests | $0.09 per 1,000 requests | $0.05 per 1,000 requests |
| Overage cap | up to 50,000 extra | up to 250,000 extra | up to 1,250,000 extra | up to 12,500,000 extra | up to 25,000,000 extra |
* Overage is off unless you turn it on in Billing (Stripe card subscriptions only). Usage is counted in monthly usage periods that start on your billing day, including on yearly plans. Requests above the included limit are billed after each usage period ends, up to the cap. If you change plans during a usage period, the limit and overage rate of the plan you are on when the period ends apply to the whole period.
Find answers to common questions about our services and API. For more help, feel free to contact our support team.
Latest blogs
Stay ahead of market trends with our expert-written blogs. Dive into valuable insights, analysis, and tips to enhance your stock and options strategies.
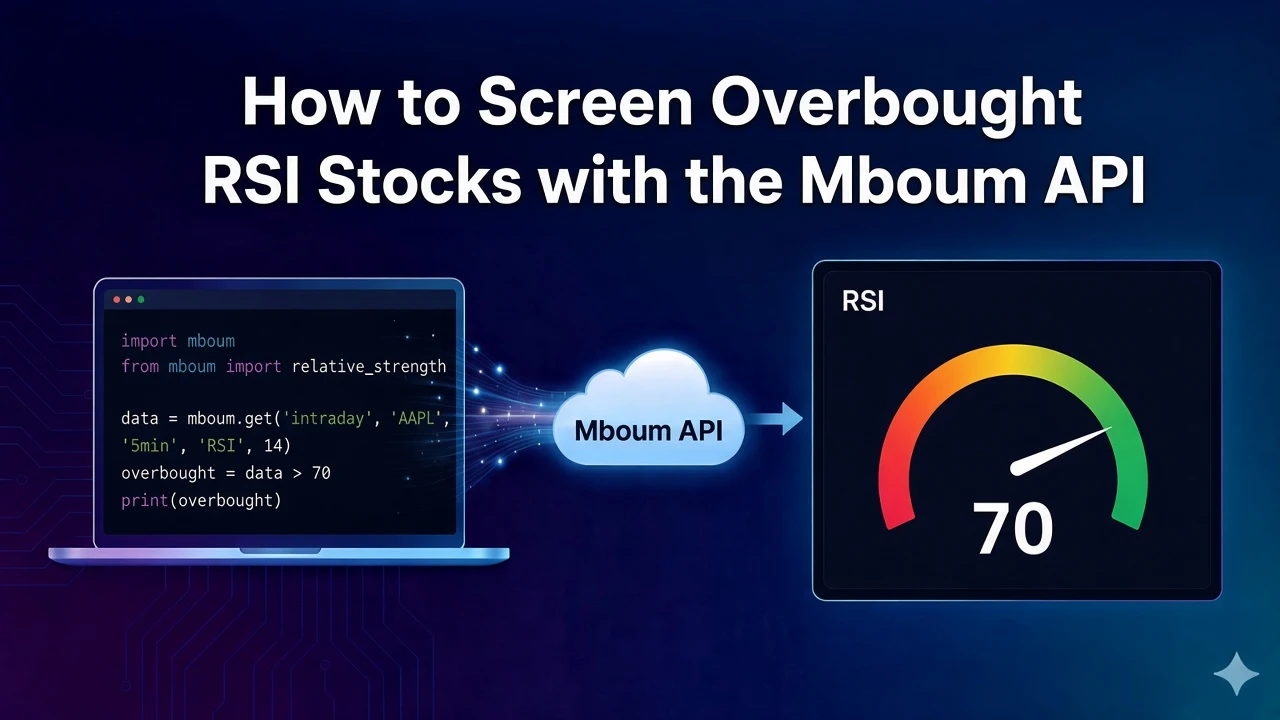
The overbought RSI screen helps you find high-volume names with a 20-day RSI above 70, without rebuilding RSI logic yourself.
READ MORE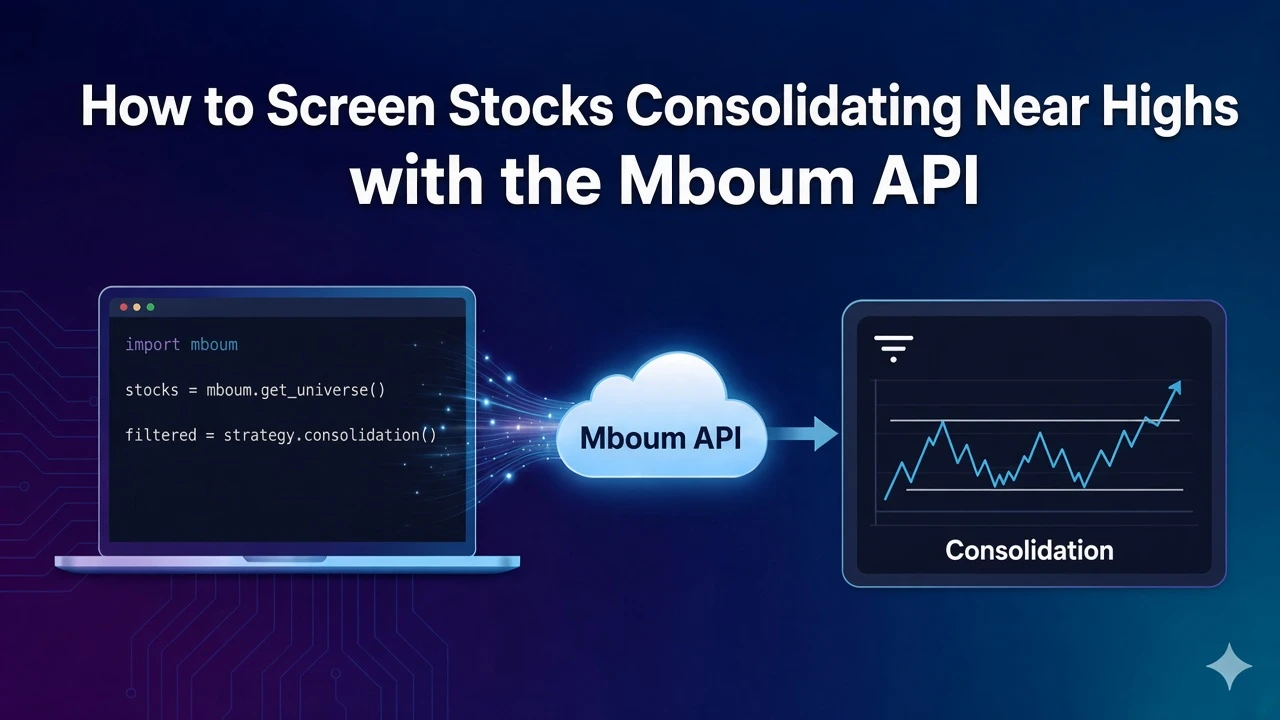
The consolidation screen helps you find strong uptrends pausing near highs, without rebuilding congestion rules yourself.
READ MORE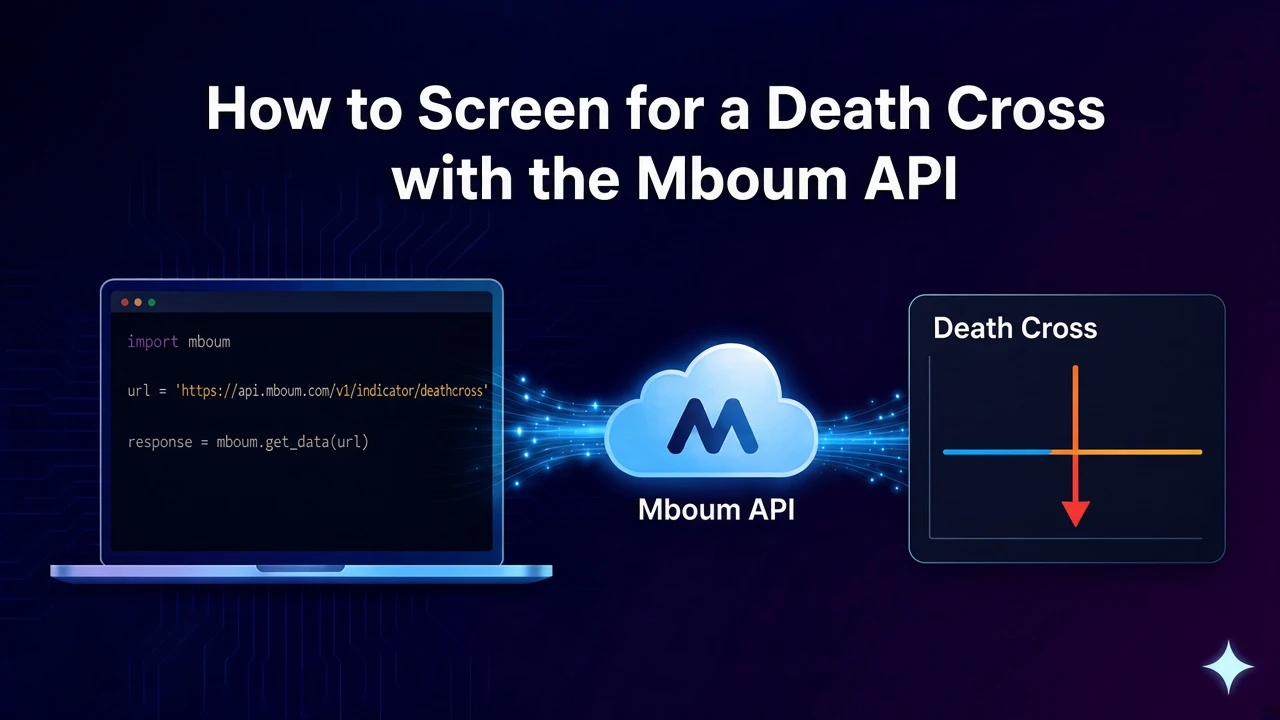
The death cross screen helps you find names where the 50-day moving average crossed below the 200-day today, without rebuilding moving-average logic yourself.
READ MORE
The golden cross screen helps you find names where the 50-day moving average crossed above the 200-day today, without rebuilding moving-average logic yourself.
READ MOREUnlock the full potential of your stock and options analysis with our powerful API. Sign up now and take your trading to the next level!