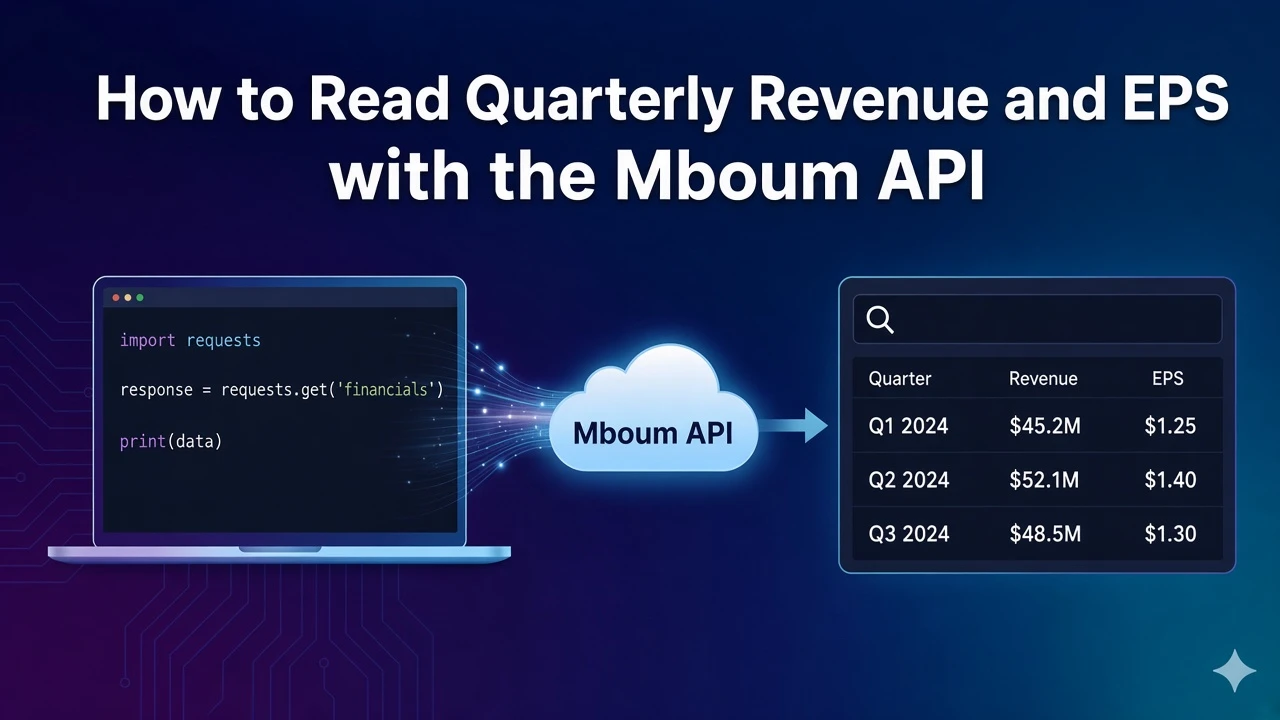
Quarterly revenue and EPS tables are a common building block for earnings dashboards and ticker detail pages. The Mboum v2 revenue endpoint returns a titled table for one ticker so you can render fiscal-quarter columns without scraping filings yourself.
This post covers GET /v2/markets/stock/revenue only. The body exposes title and revenueTable. It is not the financials endpoint, and it has no incomeStatementTable.
👉 To access this endpoint, you must obtain an API key: https://mboum.com/pages/api
The Revenue Endpoint
Revenue lives under GET /v2/markets/stock/revenue. Pass a required ticker. Optionally send page as an integer, for example 1.
Documentation:
https://docs.mboum.com/#stocks-options-GETapi-v2-markets-stock-revenue
Request
GET https://api.mboum.com/v2/markets/stock/revenue?ticker=AAPL&page=1
Authorization: Bearer YOUR_API_KEY
Parameters
ticker— required (exampleAAPL)page— optional integer (example1)
Choosing the Request
Start with ticker=AAPL and page=1. That combination returns the published revenue table shape so you can confirm body.title, header labels, and the Revenue, EPS, and Dividends rows before you chart anything.
Keep the call on the revenue route. Do not mix in financials fields or expect an income statement table in this response. Change page only after the first table parses cleanly.
Treat page as the limit depth for this route, not as a generic pagination concept from another endpoint. Once the first page looks right, adjust it when you need a deeper cut of the same table layout.
Sample Response
Shortened example of body.title and body.revenueTable. Values illustrate shape only:
{
  "body": {
    "title": "AAPL Revenue",
    "revenueTable": {
      "headers": {
        "value1": "Fiscal Quarter:",
        "value2": "Q1 2023",
        "value3": "Q4 2022",
        "value4": "Q3 2022"
      },
      "rows": [
        {
          "value1": "Revenue",
          "value2": "117.15B",
          "value3": "90.15B",
          "value4": "82.96B"
        },
        {
          "value1": "EPS",
          "value2": "$1.88 (12/31/2022)",
          "value3": "$1.29 (09/30/2022)",
          "value4": "$1.20 (06/30/2022)"
        },
        {
          "value1": "Dividends",
          "value2": "0.23",
          "value3": "0.23",
          "value4": "0.23"
        }
      ]
    }
  }
}
Python Example
import requests

url = "https://api.mboum.com/v2/markets/stock/revenue"
headers = {"Authorization": "Bearer YOUR_API_KEY"}
params = {"ticker": "AAPL", "page": 1}

response = requests.get(url, headers=headers, params=params)
response.raise_for_status()
body = response.json().get("body", {})
print(body.get("title"))
table = body.get("revenueTable") or {}
print(table.get("headers"))
for row in (table.get("rows") or [])[:5]:
    print(row.get("value1"), row.get("value2"), row.get("value3"), row.get("value4"))
Understanding the Response
The JSON body for this endpoint includes title and revenueTable only in this walkthrough. Inside the table:
headersusesvalue1,value2,value3, andvalue4rowsuse the samevalue1throughvalue4keys
A sample header sets value1 to Fiscal Quarter:, with later values naming each quarter column. Sample row labels in value1 include Revenue, EPS, and Dividends. Map columns by header order rather than inventing an income-statement layout from another route.
Walkthrough
- Call revenue with
ticker=AAPLandpage=1. - Print
body.titleand therevenueTable.headersobject to confirm the fiscal-quarter columns. - Walk the rows and print
value1throughvalue4for Revenue, EPS, and Dividends before you build charts.
Watch for This
page is sent as the limit depth for this route, and EPS cells are display strings such as $1.88 (12/31/2022), not bare floats. Parse or split those strings before you treat EPS as a number.
Stay on the revenue table until title, headers, and the Revenue, EPS, and Dividends rows render cleanly for your ticker. When you need a different fundamentals package later, use the matching endpoint instead of assuming this response includes an income statement table.
👉 Get your API key and start reading quarterly revenue: https://mboum.com/pages/api