Consensus price targets help you summarize what analysts expect for a name without collecting each research note yourself. Buy, hold, and sell counts give a quick read on how split that view is, and a historical series shows how the consensus has moved over time on the same ticker.
The Mboum price-targets endpoint returns the consensus overview and a historical consensus series for a ticker you pass in. This is the v2 stock price-targets path—not the separate v1 analyst-ratings route—so keep the URL and parameter name aligned with the docs below.
👉 To access this endpoint, you must obtain an API key: https://mboum.com/pages/api
The Price Targets Endpoint
Analyst targets live under GET /v2/markets/stock/price-targets. Pass a required ticker (for example AAPL). Do not confuse this path with /v1/markets/stock/analyst-ratings, which is a different endpoint.
Documentation:
https://docs.mboum.com/#stocks-options-GETapi-v2-markets-stock-price-targets
Choosing the Request
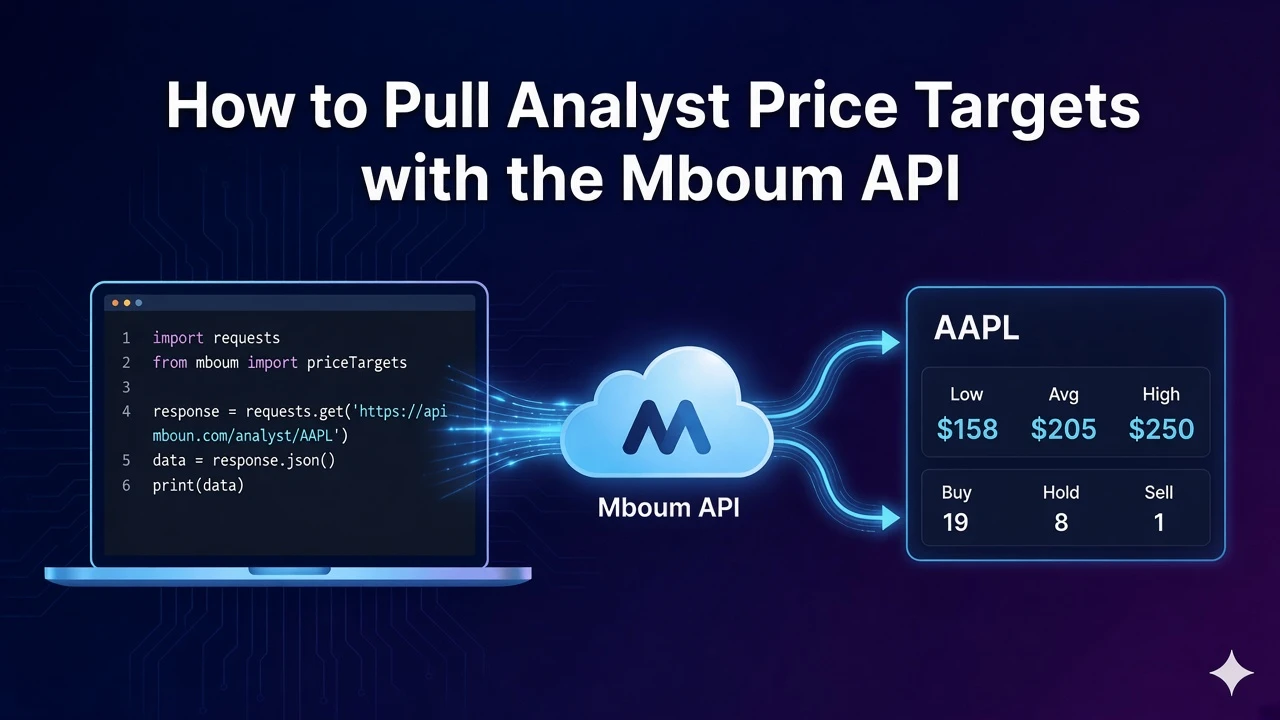
Use price-targets when you need a mean target, the high and low range, and rating counts for one symbol. Pass only the required ticker. That is enough to load research cards, compare upside versus the last quote, or chart how consensus and rating counts have changed across the historical series.
GET https://api.mboum.com/v2/markets/stock/price-targets?ticker=AAPL
Authorization: Bearer YOUR_API_KEY
Sample Response
A shortened sample shows consensusOverview plus one historicalConsensus item so you can see both shapes without a long history dump:
{
  "body": {
    "symbol": "AAPL",
    "consensusOverview": {
      "lowPriceTarget": 165.0,
      "highPriceTarget": 275.0,
      "priceTarget": 220.5,
      "buy": 28,
      "sell": 2,
      "hold": 12
    },
    "historicalConsensus": [
      {
        "x": 1727395200,
        "y": 220.5,
        "z": {
          "buy": 28,
          "hold": 12,
          "sell": 2,
          "date": "2024-09-27",
          "consensus": "Buy",
          "latest": true
        }
      }
    ]
  }
}
Python Example
import requests

url = "https://api.mboum.com/v2/markets/stock/price-targets"
headers = {"Authorization": "Bearer YOUR_API_KEY"}
params = {"ticker": "AAPL"}

response = requests.get(url, headers=headers, params=params)
response.raise_for_status()
body = response.json()["body"]
overview = body["consensusOverview"]
print(body["symbol"], overview["priceTarget"], overview["lowPriceTarget"], overview["highPriceTarget"])
print(overview["buy"], overview["hold"], overview["sell"])
hist = body.get("historicalConsensus") or []
if hist:
    item = hist[0]
    print(item["y"], item["z"]["consensus"], item["z"]["date"])
Understanding the Response
body.symbol echoes the ticker. body.consensusOverview includes lowPriceTarget, highPriceTarget, priceTarget, buy, sell, and hold. Each historicalConsensus item has x, y, and z. The z object keys are buy, hold, sell, date, consensus, and latest.
Start with the overview for a card, then walk the historical list when you need a timeline of targets and rating labels.
Walkthrough
- Call
/v2/markets/stock/price-targetswithticker=AAPL(or another symbol) and your Bearer token. - Read
consensusOverview.priceTargetas the mean target, then uselowPriceTargetandhighPriceTargetfor the range and the buy, hold, and sell counts for the split. - Walk
historicalConsensuswhen you need the series:yis the price point andz.consensusis the label such as Buy.
Watch for This
consensusOverview.priceTarget is the mean target. In historicalConsensus, y is the price point and z.consensus is the label such as Buy—do not treat those two fields as interchangeable when you chart or filter the series.
👉 Get your API key and pull price targets: https://mboum.com/pages/api